Troubleshooting Penpot #
Knowing how to do Penpot troubleshooting can be very useful; on the one hand, it helps to create issues easier to resolve, since they include relevant information from the beginning which also makes them get solved faster; on the other hand, many times troubleshooting gives the necessary information to resolve a problem autonomously, without even creating an issue.
Troubleshooting requires patience and practice; you have to read the stacktrace carefully, even if it looks like a mess at first. It takes some practice to learn how to read the traces properly and extract important information.
So, if your Penpot installation is not working as intended, there are several places to look up searching for hints.
Browser logs #
Regardless of the type of installation you have performed, you can find useful information about Penpot in your browser.
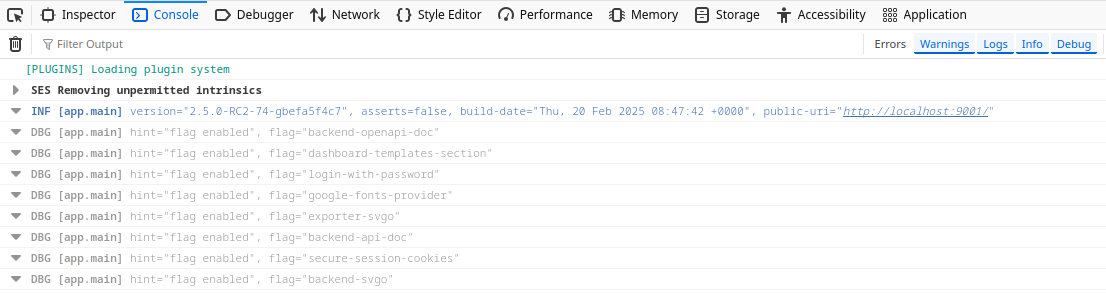
First, use the devtools to ensure which version and flags you're using. Go to your Penpot instance in the browser and press F12;
you'll see the devtools. In the Console, you can see the exact version that's being used.
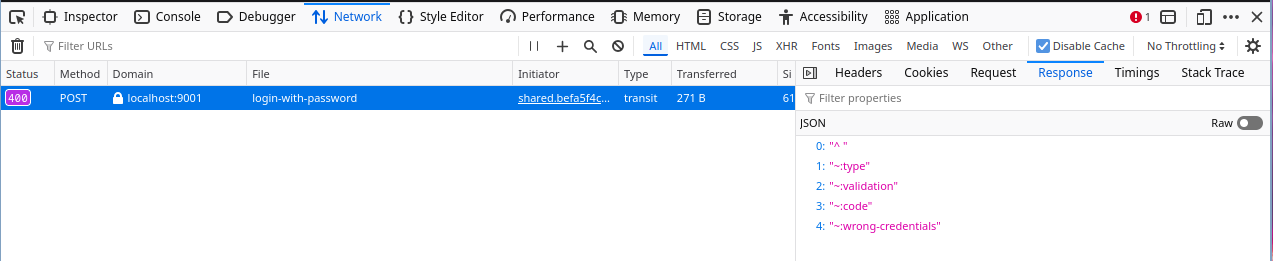
Other interesting tab in the devtools is the Network tab, to check if there is a request that throws errors.
Penpot report #
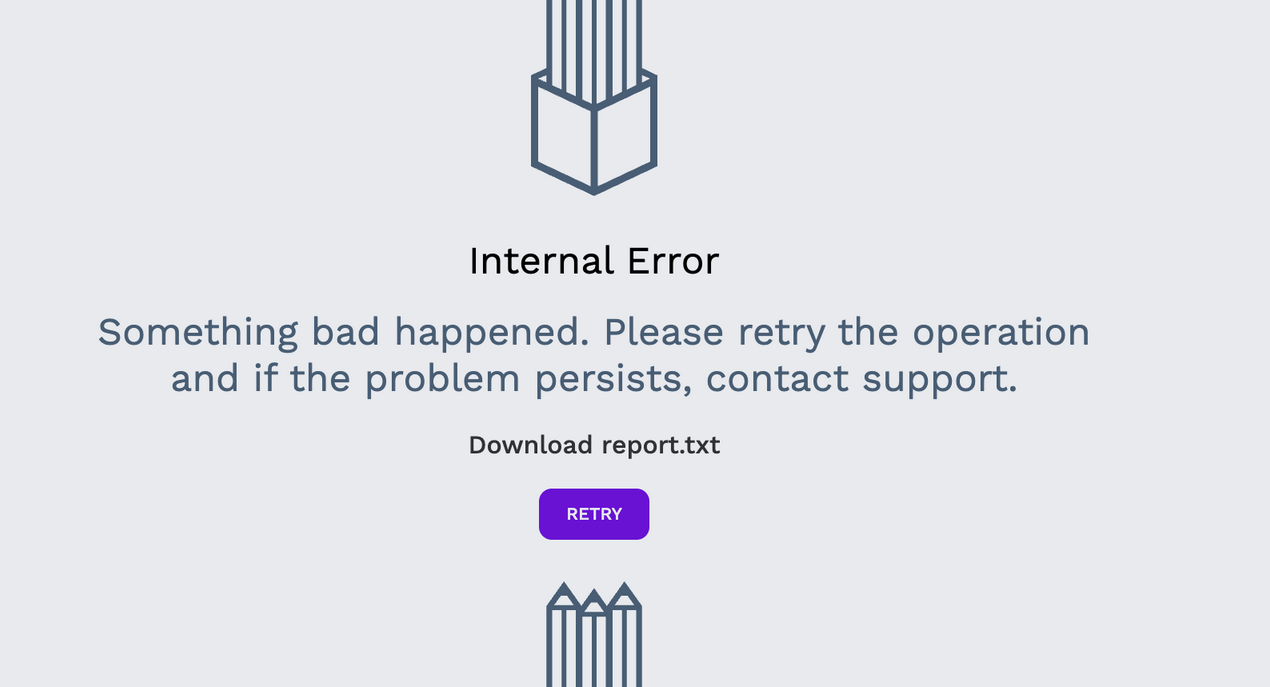
When Penpot crashes, it provides a report with very useful information. Don't miss it!
Docker logs #
If you are using the Docker installation, this is an easy way to take a look at the logs.
Check if all containers are up and running:
docker compose -p penpot -f docker-compose.yaml psCheck logs of all Penpot:
docker compose -p penpot -f docker-compose.yaml logs -fIf there is too much information and you'd like to check just one service at a time:
docker compose -p penpot -f docker-compose.yaml logs penpot-frontend -fYou can always check the logs form a specific container:
docker logs -f penpot-penpot-postgres-1