Frontend Guide #
This guide intends to explain the essential details of the frontend application.
UI #
Please refer to the UI Guide to learn about implementing UI components and our design system.
Logging, Tracing & Debugging #
Logging framework #
To trace and debug the execution of the code, one method is to enable the log
traces that currently are in the code using the Logging
framework. You can edit a
module and set a lower log level, to see more traces in console. Search for
this kind of line and change to :info or :debug:
(ns some.ns
  (:require [app.util.logging :as log]))

(log/set-level! :info)
Or you can change it live with the debug utility (see below):
debug.set_logging("namespace", "level");Temporary traces #
Of course, you have the traditional way of inserting temporary traces inside the code to output data to the devtools console. There are several ways of doing this.
Use clojurescript helper prn #
This helper automatically formats the clojure and js data structures as plain EDN for visual inspection and to know the exact type of the data.
(prn "message" expression)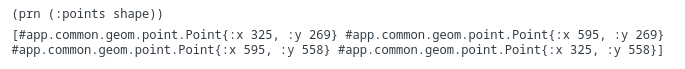
Use pprint function #
We have set up a wrapper over fipp
pprint function, that gives a human-readable formatting to the data, useful
for easy understanding of larger data structures.
The wrapper allows to easily specify level, length and width parameters,
with reasonable defaults, to control the depth level of objects to print, the
number of attributes to show and the display width.
(:require [app.common.pprint :refer [pprint]])

;; On the code
(pprint shape {:level 2
               :length 21
               :width 30})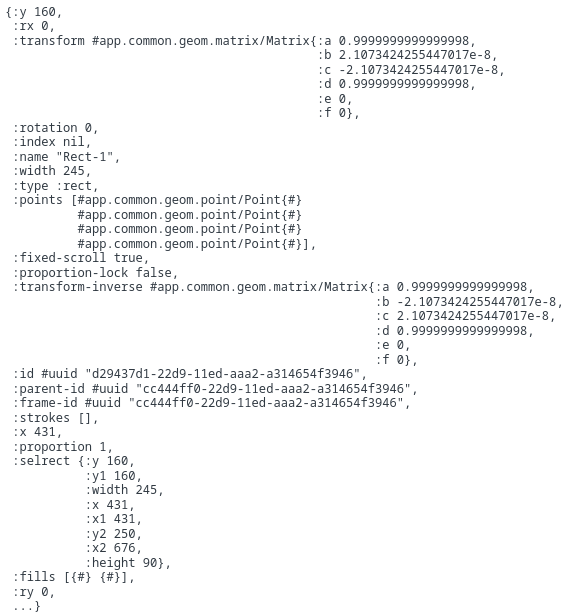
Use the js native functions #
The clj->js function converts the clojure data structure into a javacript
object, interactively inspectable in the devtools.console.
(js/console.log "message" (clj->js expression))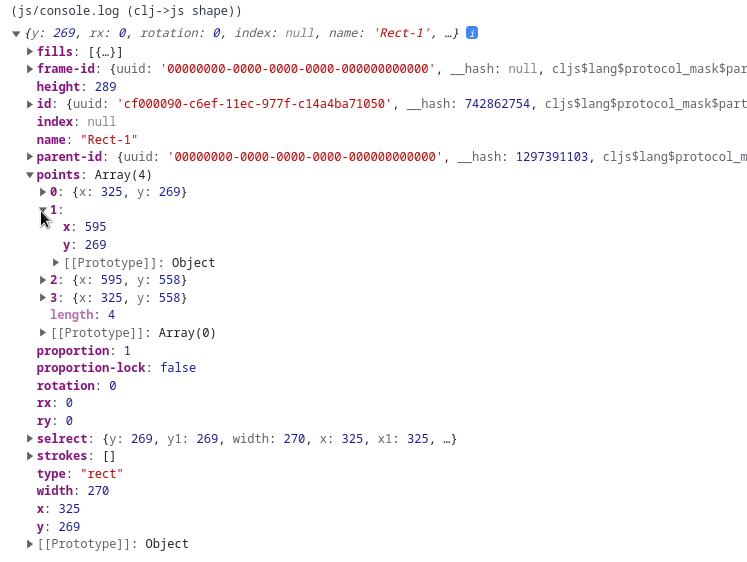
Breakpoints #
You can insert standard javascript debugger breakpoints in the code, with this function:
(js-debugger)The Clojurescript environment generates source maps to trace your code step by step and inspect variable values. You may also insert breakpoints from the sources tab, like when you debug javascript code.
One way of locating a source file is to output a trace with (js/console.log)
and then clicking in the source link that shows in the console at the right
of the trace.
Access to clojure from js console #
The penpot namespace of the main application is exported, so that is accessible from javascript console in Chrome developer tools. Object names and data types are converted to javascript style. For example you can emit the event to reset zoom level by typing this at the console (there is autocompletion for help):
app.main.store.emit_BANG_(app.main.data.workspace.reset_zoom);Debug utility #
We have defined, at src/debug.cljs, a debug namespace with many functions
easily accesible from devtools console.
Change log level #
You can change the log level of one namespace without reloading the page:
debug.set_logging("namespace", "level");Dump state and objects #
There are some functions to inspect the global state or parts of it:
// print the whole global state
debug.dump_state();

// print the latest events in the global stream
debug.dump_buffer();

// print a key of the global state
debug.get_state(":workspace-data :pages 0");

// print the objects list of the current page
debug.dump_objects();

// print a single object by name
debug.dump_object("Rect-1");

// print the currently selected objects
debug.dump_selected();

// print all objects in the current page and local library components.
// Objects are displayed as a tree in the same order of the
// layers tree, and also links to components are shown.
debug.dump_tree();

// This last one has two optional flags. The first one displays the
// object ids, and the second one the {touched} state.
debug.dump_tree(true, true);
And a bunch of other utilities (see the file for more).
Workspace visual debug #
Debugging a problem in the viewport algorithms for grouping and
rotating is difficult. We have set a visual debug mode that displays
some annotations on screen, to help understanding what's happening.
This is also in the debug namespace.
To activate it, open the javascript console and type:
debug.toggle_debug("option");Current options are bounding-boxes, group, events and
rotation-handler.
You can also activate or deactivate all visual aids with
debug.debug_all();
debug.debug_none();
Translations (I18N) #
How it works #
All the translation strings of this application are stored in
standard gettext files in frontend/translations/*.po.
They have a self explanatory format that looks like this:
#: src/app/main/ui/auth/register.cljs, src/app/main/ui/auth/login.cljs
msgid "auth.create-demo-account"
msgstr "Create demo account"
The files are automatically bundled into the index.html file on
compile time (in development and production). The bundled content is a
simplified version of this data structure to avoid loading unnecesary
data. The development environment has a watch process that detect
changes on that file and recompiles the index.html.
There are no hot reload for translations strings, you just need to refresh the browser tab to refresh the translations in the running the application.
Finally, when you have finished adding texts, execute the following command inside the devenv, to reformat the file before commiting the file into the repository:
# cd <repo>/frontend
pnpm run translations
At Penpot core team we maintain manually the english and spanish .po files. All the others are managed in https://weblate.org.
When a new language is available in weblate, to enable it in the application you need to add it in two places:
frontend/src/app/util/i18n.cljs (supported-locales)
frontend/gulpfile.js (const langs)
How to use it #
You need to use the app.util.i18n/tr function for lookup translation
strings:
(require [app.util.i18n :as i18n :refer [tr]])

(tr "auth.create-demo-account")
;; => "Create demo account"
If you want to insert a variable into a translated text, use %s as
placeholder, and then pass the variable value to the (tr ...) call.:
#: src/app/main/ui/settings/change_email.cljs
msgid "notifications.validation-email-sent"
msgstr "Verification email sent to %s. Check your email!"(require [app.util.i18n :as i18n :refer [tr]])
(tr "notifications.validation-email-sent" email)
;; => "Verification email sent to [email protected]. Check your email!"If you have defined plurals for some translation resource, then you need to pass an additional parameter marked as counter in order to allow the system know when to show the plural:
#: src/app/main/ui/dashboard/team.cljs
msgid "labels.num-of-projects"
msgid_plural "labels.num-of-projects"
msgstr[0] "1 project"
msgstr[1] "%s projects"(require [app.util.i18n :as i18n :refer [tr]])
(tr "labels.num-of-projects" (i18n/c 10))
;; => "10 projects"
(tr "labels.num-of-projects" (i18n/c 1))
;; => "1 project"Integration tests #
Setup #
To run integration tests locally, follow these steps.
Ensure your development environment docker image is up to date.
- If it is not up to date, run:
./manage.sh pull-devenv- Once the update is complete, start the environment:
./manage.sh start-devenvNOTE You can learn more about how to set up, start and stop our development environment here
Release mode #
This is not required, but it may be convenient to compile Penpot in release mode before running the tests. This way they will be much quicker and stable. For this, go to the frontend window in the tmux session (Ctrl + b 1), interrupt the watch process with Ctrl + C and type:
./scripts/buildObviously, in this mode if you make changes to the source code, you will need to repeat the build manually each time. It may be useful to use wath mode when debugging a single test, and use release mode to run all the suite.
Running the integration tests #
Headless mode #
Here's how to run the tests with a headless browser (i.e. within the terminal, no UI):
-
With the developer environment tmux session opened, create a new tab with
Ctrl + b c. -
Go to the frontend folder:
cd penpot/frontend- Run the tests with
pnpm:
pnpm run test:e2e💡 TIP: By default, the tests will not run in parallel. You can set the amount of workers to run the tests with
--workers. Note that, depending on your machine, this might make some tests flaky.
# run in parallel with 4 workers
pnpm run test:e2e --workers 4
Running the tests in Chromium #
To access the testing UI and run the tests in a real browser, follow these steps:
- In a terminal in your host machine, navigate to the
frontendfolder, then run:
# cd <repo>/frontend
npx playwright test --ui
⚠️ WARNING: It is important to be in the right folder (
frontend) to launch the command above, or you may have errors trying to run the tests.
❗️ IMPORTANT: You might need to install Playwright's browsers and dependencies in your host machine with:
npx playwright install --with-deps. In case you are using a Linux distribution other than Ubuntu, you might need to install the dependencies manually.
You will also need pnpm in your host nodejs. For this, do
corepack enableand then justpnpm.
How to write a test #
When writing integration tests, we are simulating user actions and events triggered by them, in other to mirror real-world user interactions. The difference with fully end-to-end tests is that here we are faking the backend by intercepting the network requests, so tests can run faster and more tied to the front-end.
Keep in mind:
-
Use Realistic User Scenarios: Design test cases that mimic real user scenarios and interactions with the application.
-
Simulate User Inputs: Such as mouse clicks, keyboard inputs, form submissions, or touch gestures, using the testing framework's API. Mimic user interactions as closely as possible to accurately simulate user behavior.
-
Intercept the network: Playwright offers ways to fake network responses to API calls, websocket messages, etc. Remember that there is no backend here, so you will need to intercept every request made by the front-end app.
Page Object Model #
When writing a significant number of tests, encountering repetitive code and common actions is typical. To address this issue, we recommend leveraging Page Object Models (POM), which is a single class that encapsulates common locators, user interactions, etc.
POMs do not necessarily refer to entire pages but can also represent specific regions of a page that are the focus of our tests. For example, we may have a POM for the login form, or the projects section.
In a POM, we can define locators in the constructor itself — remember that locators will be accessed when interacted with (with a click(), for instance) or when asserting expectations.
class LoginPage {
  constructor(page) {
    super(page);
    this.loginButton = page.getByRole("button", { name: "Login" });
    this.passwordInput = page.getByLabel("Password");
    this.emailInput = page.getByLabel("Email");
  }

  // ...
}
We can later use this POM and its locators:
test("Sample test", async ({ page }) => {
  const loginPage = new loginPage(page);
  // ...
  await expect(loginPage.loginButton).toBeVisible();
});
💡 TIP: Locators that are generic and meant to be used in multiple tests should be part of the POM.
If your locator is ad-hoc for a specific test, there's no need to add it to the POM.
In addition to locators, POMs also include methods that perform common actions on those elements, like filling out a group of related input fields.
class LoginPage {
  // ...
  async fillEmailAndPasswordInputs(email, password) {
    await this.emailInput.fill(email);
    await this.passwordInput.fill(password);
  }
}
POMs can also include the interception of network requests (but only include interceptions commont to multiple tests in the POM):
class LoginPage {
  // ...
  async setupLoginSuccess() {
    await this.mockRPC(
      "login-with-password",
      "logged-in-user/login-with-password-success.json"
    );
  }
}
Here's an example of a test that uses a POM:
test("User submits a wrong formatted email", async ({ page }) => {
  const loginPage = new LoginPage(page);
  await loginPage.setupLoginSuccess();

  await loginPage.fillEmailAndPasswordInputs("foo", "lorenIpsum");

  await expect(loginPage.errorLoginMessage).toBeVisible();
});
Mocking the back-end #
In the penpot repository there are some POMs that are meant to be extended by more specific pages. These include methods that should be useful when you write your own POMs.
-
BasePagecontains methods to intercept network requests and return JSON data fixtures. -
BaseWebSocketPagealso can intercept websocket connections, which are a must for tests in the workspace, or any other Penpot page that uses a WebSocket.
API calls #
In order to mock API calls we just need to extend from the BasePage POM and then call its method mockRPC:
export class FooPage extends BasePage {
  setupNetworkResponses() {
    this.mockRPC("lorem/ipsum", "json-file-with-fake-response.json");

    // Regexes are supported too
    this.mockRPC(
      /a\-regex$/
      "json-file-with-fake-response.json"
    );

    // ...You can also pass custom status code and override other options
    this.mockRPC("something/not/found", "json-file-with-fake-response.json", {
      status: 404,
    });
  }
}
❗️ IMPORTANT: The
mockRPCmethod is meant to intercept calls to Penpot's RPC API, and already prefixes the path you provide with/api/rpc/command/. So, if you need to intercept/api/rpc/command/get-profileyou would just need to callmockRPC("get-profile", "json-data.json").
WebSockets #
Any Penpot page that uses a WebSocket requires it to be intercepted and mocked. To do that, you can extend from the POM BaseWebSocketPage and call its initWebSockets() methods before each test.
Here's an an actual example from the Penpot repository:
// frontend/playwright/ui/pages/WorkspacePage.js
export class WorkspacePage extends BaseWebSocketPage {
  static async init(page) {
    await BaseWebSocketPage.init(page);
    // ...
  }
}
// frontend/playwright/ui/specs/workspace.spec.js
test.beforeEach(async ({ page }) => {
await WorkspacePage.init(page);
});BaseWebSocketPage also includes methods to wait for a specific WebSocket connection and to fake sending/receiving messages.
When testing the workspace, you will want to wait for the /ws/notifications WebSocket. There's a convenience method, waitForNotificationsWebSocket to do that:
// frontend/playwright/ui/pages/WorkspacePage.js
export class WorkspacePage extends BaseWebSocketPage {
  // ...

  // browses to the Workspace and waits for the /ws/notifications socket to be ready
  // to be listened to.
  async goToWorkspace() {
    // ...
    this.#ws = await this.waitForNotificationsWebSocket();
    await this.#ws.mockOpen();
    // ...
  }

  // sends a message over the notifications websocket
  async sendPresenceMessage(fixture) {
    await this.#ws.mockMessage(JSON.stringify(fixture));
  }

  // ...
}
// frontend/playwright/ui/specs/workspace.spec.js
test("User receives presence notifications updates in the workspace", async ({
page,
}) => {
const workspacePage = new WorkspacePage(page);
// ...
await workspacePage.goToWorkspace();
await workspacePage.sendPresenceMessage(presenceFixture);
await expect(
page.getByTestId("active-users-list").getByAltText("Princesa Leia")
).toHaveCount(2);
});Best practices for writing tests #
Our best practices are based on Testing library documentation.
This is a summary of the most important points to take into account:
Query priority for locators #
For our integration tests we use Playwright, you can find more info about this library and the different locators here.
Locator queries are the methods to find DOM elements in the page. Your test should simulate as closely as possible the way users interact with the application. Depending on the content of the page and the element to be selected, we will choose one method or the other following these priorities:
- Queries accessible to everyone: Queries that simulate the experience of visual users or use assistive technologies.
-
page.getByRole: To locate exposed elements in the accessibility tree. -
page.getByLabel: For querying form fields. -
page.getByPlaceholder: For when the placeholder text is more relevant than the label (or the label does not exist). -
page.getByText: For the non-form elements that also do not have a role in the accesibility tree, but have a distintive text.
- Semantic queries: Less preferable than the above, since the user experience when interacting with these attributes may differ significantly depending on the browser and assistive technology being used.
-
page.byAltText: For elements that supportalttext (<img>,<area>, a custom element, etc.). -
page.byTitle: For elements with atitle.
- Test IDs: If none of the queries above are feasible, we can locate by the
data-testidattribute. This locator is the least preffered since it's not user-interaction oriented.
page.getByTestId: For elements with adata-testidattribute.
A practical example for using locator queries. #
Given this DOM structure:
<form>
  <p>Penpot is the free open-...</p>
  <label for="email">
    Email
    <input placeholder="Email" name="email" type="email" id="email" value="" />
  </label>

  <label for="password">
    Password
    <input
      placeholder="Password"
      name="password"
      type="password"
      id="password"
      value=""
    />
  </label>
  <button type="submit">Login</button>
</form>
The DOM above represents this part of the app:
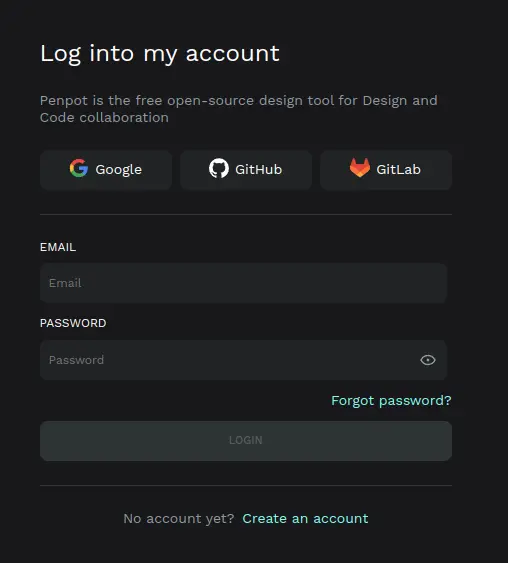
Our first task will be to locate the login button:
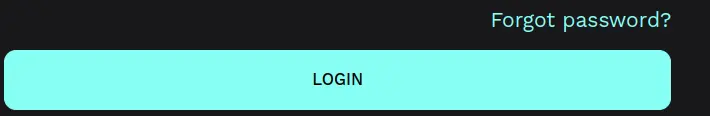
Our initial approach involves following the instructions of the first group of locators, "Queries accessible to everyone". To achieve this, we inspect the accessibility tree to gather information:
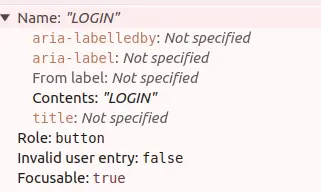
Having examined the accessibility tree, we identify that the button can be located by its role and name, which is our primary option:
page.getByRole("button", { name: "Login" });For selecting the <input> within the form, we opt for getByLabel, as it is the recommended method for locating form inputs:
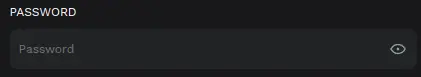
page.getByLabel("Password");If we need to locate a text with no specific role, we can use the getByText method:
page.getByText("Penpot is the free open-");To locate the rest of the elements we continue exploring the list of queries according to the order of priority. If none of the above options match the item, we resort to getByTestId as a last resort.
Assertions #
Assertions use Playwright's expect method. Here are some tips for writing your assertions:
-
Keep assertions clear and concise: Each assertion should verify a single expected behavior or outcome. Avoid combining multiple assertions into a single line, to maintain clarity and readability.
-
Use descriptive assertions: Use assertion messages that clearly communicate the purpose of the assertion.
-
Favor writing assertions from the user's point of view: For instance, whenever possible, assert things about elements that the user can see or interact with.
-
Cover the error state of a page: Verify that the application handles errors gracefully by asserting the presence of error messages. We do not have to cover all error cases, that will be taken care of by the unit tests.
-
Prefer positive assertions: Avoid using
.notin your assertions (i.e.expect(false).not.toBeTruthy()) —it helps with readability.
Naming tests #
-
User-centric approach: Tests should be named from the perspective of user actions. For instance,
"User logs in successfully"instead of"Test login". -
Descriptive names: Test names should be descriptive, clearly indicating the action being tested.
-
Clarity and conciseness: Keep test names clear and concise.
-
Use action verbs: Start test names with action verbs to denote the action being tested. Example:
"Adds a new file to the project".